

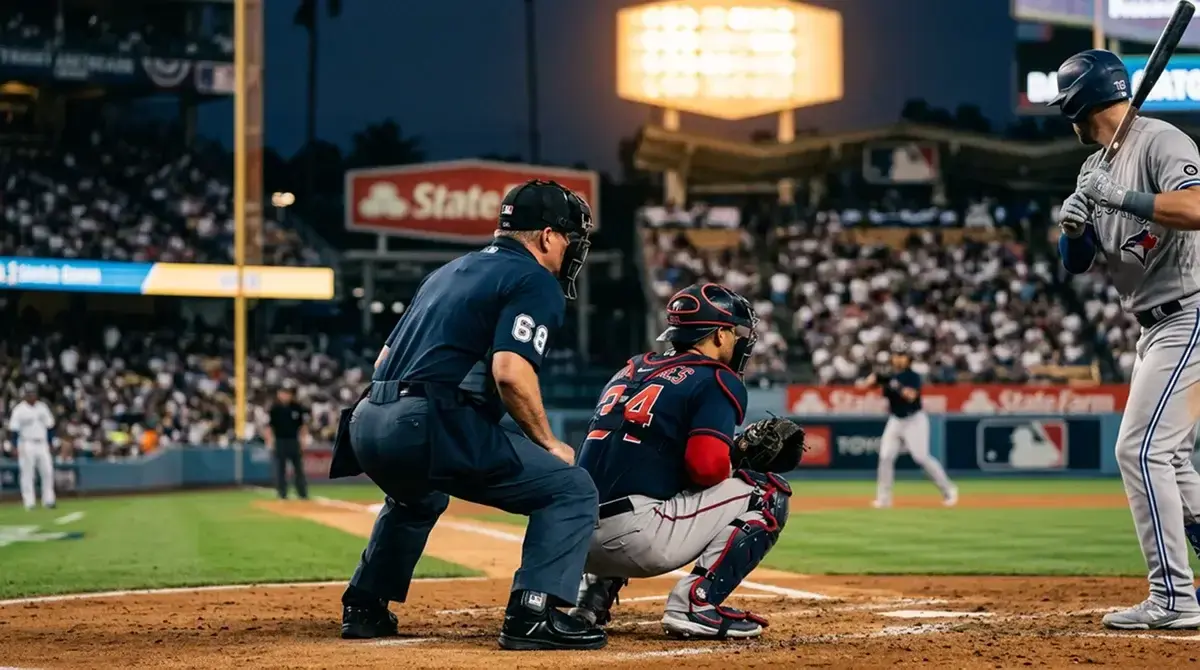
Two years ago, I started tracking umpire assignments as part of my pre-game routine — mostly out of curiosity. Within a month, I was genuinely shocked by how much variability existed. One home plate umpire’s games averaged a full run more than another’s over an 80-game sample. A full run. That’s the difference between an over and an under hitting on an 8.5 total, and most bettors don’t even bother checking who’s behind the plate.
Applying Umpire Strike Zone Tendencies to Run Totals
Commissioner Rob Manfred has talked about the sport reaching “a different level” in terms of analytics and technology. That evolution extends to umpire tracking — every called strike and ball is now recorded, measured against the official strike zone, and graded for accuracy. The data confirms what observant bettors have suspected: umpires have personal strike zones, and those zones meaningfully influence run scoring.
An umpire with a wide strike zone — one who consistently calls pitches off the edge of the plate as strikes — suppresses offence. Batters have to protect against a wider area, leading to more defensive swings, more weak contact, and fewer walks. Fewer walks means fewer baserunners, which means fewer runs. Conversely, a tight-zone umpire shrinks the pitcher’s effective target, forcing more pitches over the heart of the plate. Batters feast on those pitches, walk rates climb, and scoring increases.
The magnitude of this effect is bigger than you’d expect. Umpires at the extremes can influence game totals by 0.5 to 1.0 runs compared to league average — accumulated over nine innings and two and a half hours of play. On a slate of 15 games with 2,430 total in a season, that gives you roughly 160 chances per year to use umpire data as an edge, and the market barely prices it in.
I don’t claim that umpire tendencies are a standalone betting strategy. But as a modifier — adjusting my expected total up or down by a quarter to half a run based on the home plate assignment — they’ve added measurable value to my totals betting. The signal is small on any individual game but compounds meaningfully over a full season.
Where to Find Umpire Data
The good news for UK bettors: umpire data is some of the most accessible free analytical content in baseball. Several dedicated umpire-tracking sites grade every home plate umpire after every game, publishing accuracy percentages, strike zone size relative to the rulebook zone, and historical run-scoring averages.
The most useful metrics for betting purposes are: the umpire’s historical total runs per game (compared to the league average for those same matchups), their called strike rate (percentage of taken pitches called as strikes), and their walk rate impact (how many more or fewer walks occur in their games versus average). I maintain a simple spreadsheet with each active umpire’s key numbers and update it weekly during the season — a ten-minute task that feeds directly into my daily handicapping.
Umpire assignments for MLB games are typically announced the day before the game, sometimes two days ahead. For UK punters, this means the information is available well before you need to place any bets. I check assignments as part of my morning routine — alongside probable pitchers and weather — and flag any games where an extreme umpire (top or bottom 15% by run-scoring impact) is behind the plate. Those flagged games get extra attention in my totals analysis.
Building your own umpire database doesn’t require advanced skills. A simple spreadsheet tracking each umpire’s games officiated, total runs in those games, and the deviation from the posted total is enough to identify the outliers. After about 30-40 games for a given umpire, the patterns stabilise enough to be predictive. Over a season with 2,430 total games and a pool of roughly 90 active umpires, each ump works approximately 130 games — more than enough data for reliable analysis by mid-season.
One caveat: the automated ball-strike system (often called “robo-ump”) has been tested in the minor leagues and may eventually reach the majors. If and when it does, umpire strike zone tendencies will be eliminated as a variable. Until then, human umpires bring human biases, and those biases are exploitable. Keep an eye on rule changes — the landscape could shift within the next few seasons.
Practical Umpire-Based Betting Edges
I use umpire data in two specific markets. The first is totals. When a wide-zone umpire is assigned to a game with two quality starters, the under becomes more attractive because the expanded strike zone will help those pitchers dominate even more than their stats suggest. When a tight-zone umpire is assigned to a game with mediocre starters, the over gets a boost because those pitchers will face a smaller effective zone and issue more walks.
The second market is pitcher strikeout props. Umpires who call a wide zone generate more called strikes, which increases the strikeout rate for pitchers who work the edges of the plate. A pitcher with a high strikeout rate throwing in front of a wide-zone umpire is a strong candidate for the over on his strikeout prop. The market sets these props based on the pitcher’s average performance; it rarely adjusts for who’s calling balls and strikes.
The edge from umpire analysis is not large enough to build an entire strategy around. Think of it as a tiebreaker — the factor that pushes a marginal play from “maybe” to “yes.” When your pitching matchup analysis, park factor, and weather data all point toward the under, and the assigned umpire has a historically wide strike zone, the convergence of signals creates a high-confidence play. When all your indicators are neutral and only the umpire data points one way, that’s not enough to justify a bet on its own.
